DuskProof Validators Platform
DuskProof Validators Platform
DuskProof Validators Platform — a web dashboard for monitoring, analyzing, and interacting with proof-of-stake validator networks.
The platform is focused on transparent on-chain data, network analytics, and wallet actions — not ranking validators with a proprietary score.
Celestia https://app.duskproof.com/celestia
Platform Overview
Celestia gets its own branded space with:
-
Mainnet / testnet switching
-
Sidebar navigation
-
Shared dark UI
Data is pulled from chain REST/RPC endpoints, cached by background workers, and refreshed continuously.
 Validators
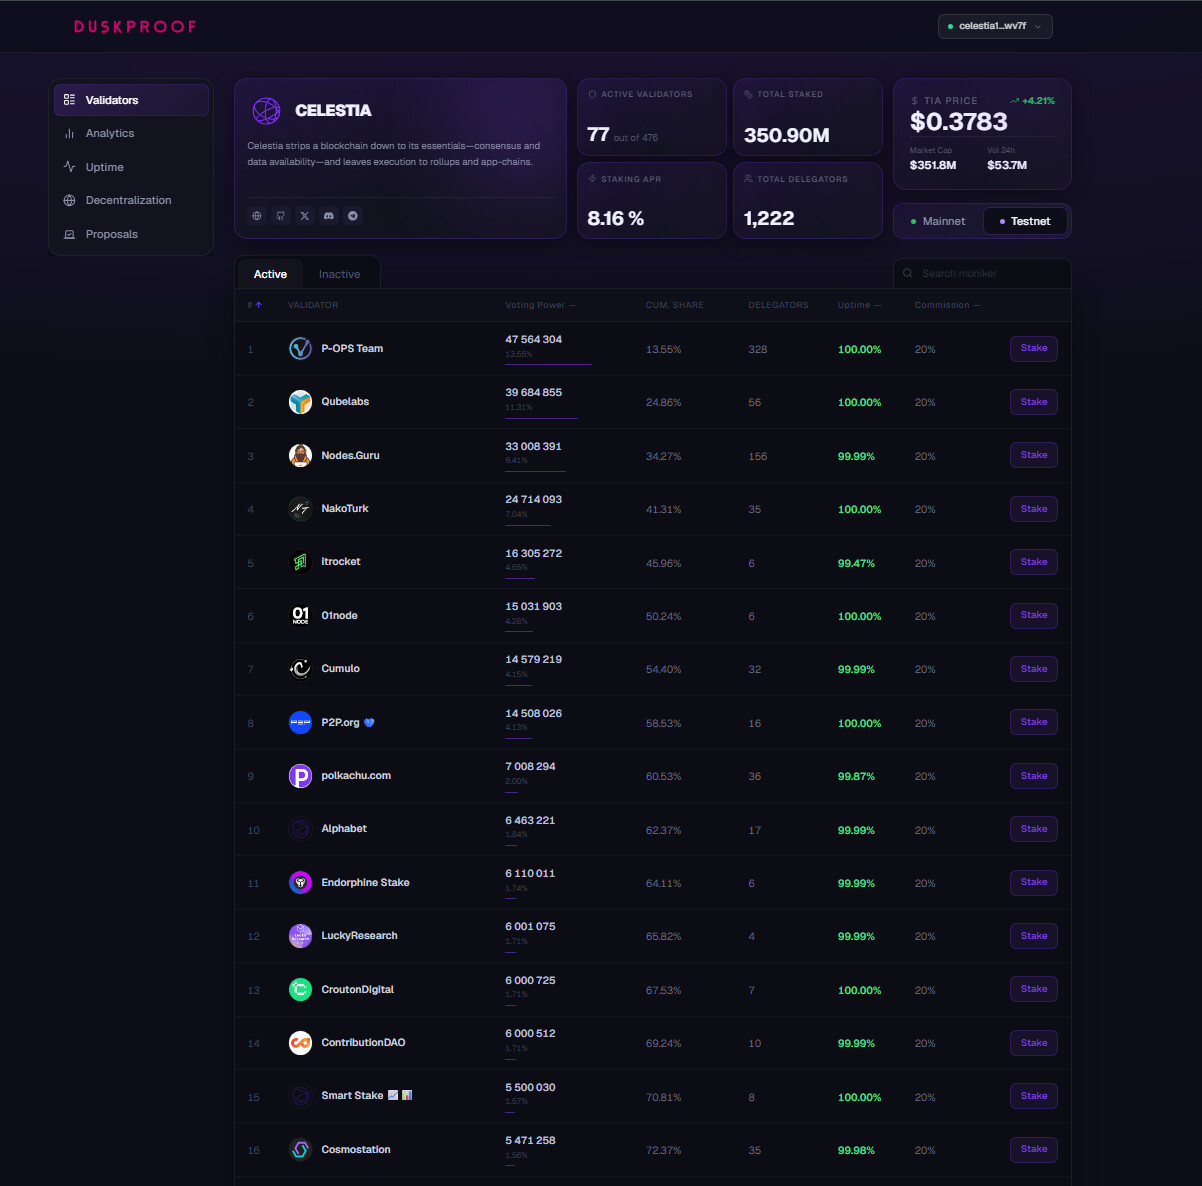
Leaderboard — /{project}/
-
Sortable table: rank, voting power, cumulative VP share, delegators, 30d uptime, commission
-
Active / inactive filter, moniker search
-
Keybase avatars
-
Stake button on each row
-
Network stats: active validators, total staked, staking APR, total delegators
-
Token price widget (price, 24h change, market cap, volume)
-
Project branding: logo, description, social links
Validator Profile — /{project}/validators/{address}

-
Breadcrumb trail: project → network → validator moniker
-
Status badge (Active / Jailed / Inactive), website, Keybase identity, security contact
-
Validator description from on-chain metadata
-
Delegate CTA (Keplr) in the header
-
Economics cards: self-bonded, APR (+ inflation), commission (+ last update date), change rates (max rate, max daily change, slash fraction)
-
Addresses panel: operator, consensus, consensus pubkey — one-click copy
-
Node information: IP, geo location, hosting provider, ASN, infrastructure type (datacenter vs bare metal)
-
Proposer performance: donut chart + proposed / missed blocks, first & last proposed height
-
Slashing parameters: uptime, missed blocks window, min signed per window, active since block, downtime & double-sign slash rates
-
Total bonded history chart
-
Block participation grid (signing history)
Example: P-OPS Team on Celestia testnet
What you see on this page:
-
Header: DuskProof navbar + connected Keplr wallet (
celestia1…) in the top right -
Breadcrumb:
Celestia / testnet / P-OPS Team— quick context for network and validator -
Identity card: Keybase avatar, moniker, Active status, on-chain description, links to website & Keybase, purple Delegate button
-
Top metrics row:
-
Self Bonded — amount in native token
-
APR — staking yield with inflation sub-label
-
Commission — current rate + last update date
-
Change Rates — max commission, max daily change, slash (double-sign) %
-
-
Addresses: operator, consensus address, consensus key — each with copy icon
-
Node Information: resolved IP, city/region/country, provider, ASN, infrastructure label (e.g. datacenter name)
-
Proposer Performance: circular chart (e.g. 100% proposed), block counts, first/last proposed heights
-
Slashing Parameters: uptime %, missed/window, min signed %, active-since block, slash rates for downtime & double-sign
Everything on this page comes from live chain + indexed data — no proprietary score.
 Uptime
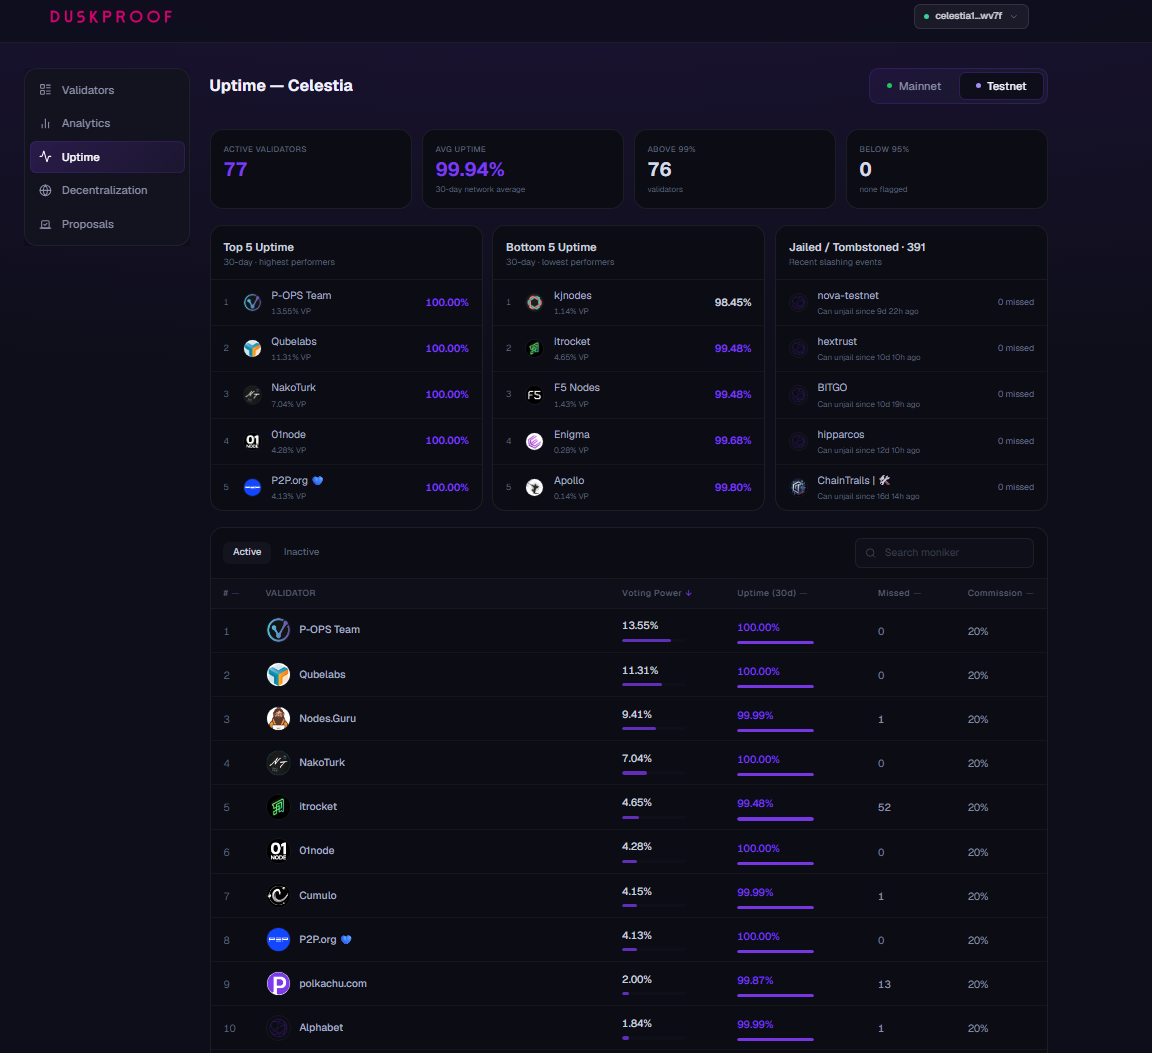
Network Dashboard — /{project}/uptime
-
KPIs: active validators, average 30d uptime, count ≥99%, count <95%
-
Top 5 / Bottom 5 / Jailed quick lists
-
Full table: VP, uptime, missed blocks, commission
Per‑validator Uptime — /{project}/uptime/{address}
-
Validator header with Keybase avatar and moniker
-
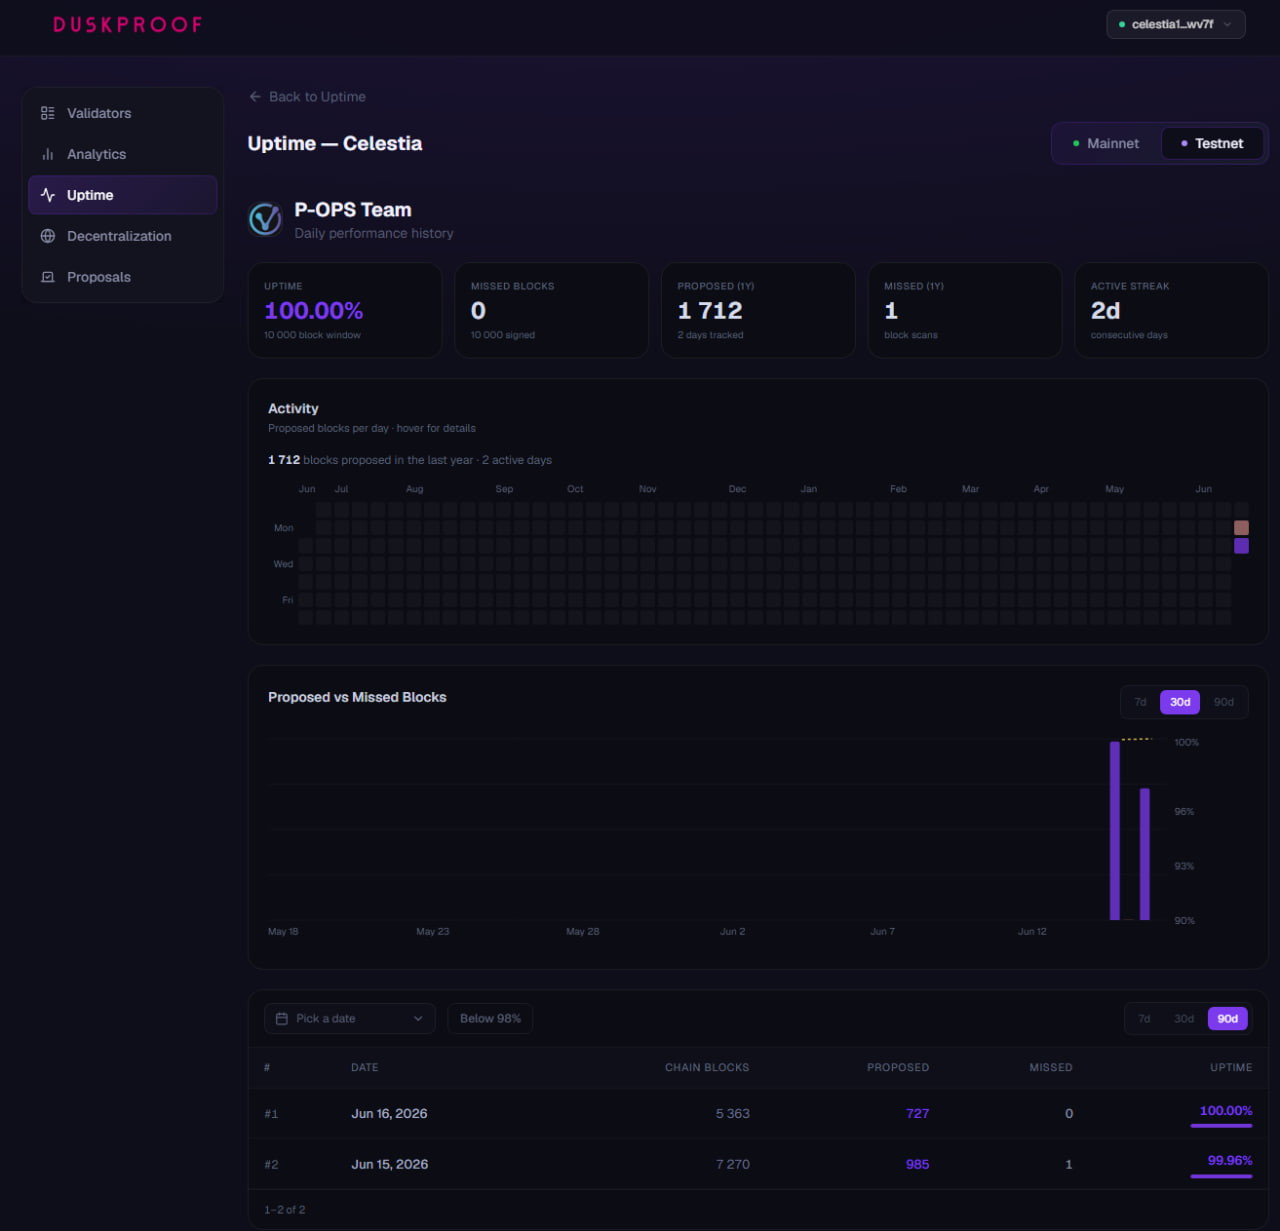
5 KPI cards: uptime (slashing window), missed blocks, proposed (1y), missed (1y), active streak (consecutive days)
-
Activity heatmap — GitHub-style grid of proposed blocks per day (hover for details)
-
Proposed vs Missed Blocks chart with 7d / 30d / 90d range
-
Daily breakdown table: date, chain blocks, proposed, missed, uptime % with progress bar
-
Filters: date picker, Below 98% toggle, timeline tabs (7d / 30d / 90d)
-
Back to Uptime link + mainnet / testnet switcher
Example: P-OPS Team uptime — Celestia testnet
What you see on this page:
-
Sidebar: Validators · Analytics · Uptime · Decentralization · Proposals
-
Network toggle: Mainnet / Testnet in the page header
-
Validator block: avatar, moniker (e.g. P-OPS Team), subtitle “Daily performance history”
-
KPI row (5 cards):
-
Uptime — e.g. 100.00% over a 10,000-block slashing window
-
Missed Blocks — current window count + signed total
-
Proposed (1y) — blocks proposed in the tracked period
-
Missed (1y) — missed blocks from block scans
-
Active Streak — consecutive days with activity
-
-
Activity heatmap: 12-month grid — proposed blocks per day; summary line (e.g. “1,712 blocks proposed in the last year”)
-
Proposed vs Missed Blocks: bar chart with 7d / 30d / 90d tabs
-
Daily breakdown table: sortable rows with Date, Chain Blocks, Proposed, Missed, Uptime % — plus Pick a date and Below 98% filters
Useful for validators and delegators who want day-by-day performance, not just a single uptime number.
 Analytics
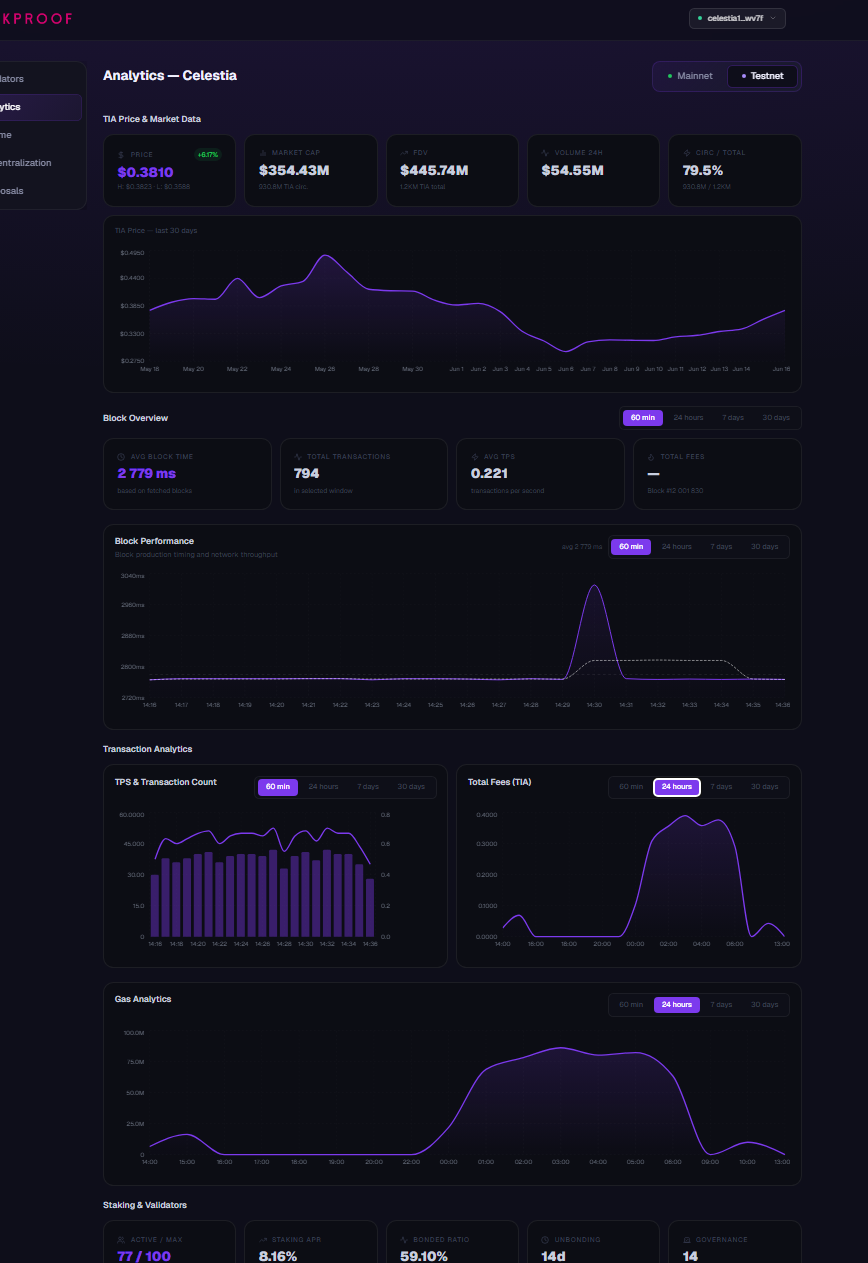
Network Analytics — /{project}/analytics
-
Price & market — token price, market data
-
Blocks — height, avg block time, transactions, fees, TPS (60min / 24h / 7d / 30d)
-
Gas analytics — gas usage trends
-
Staking — active/max validators, APR, bonded ratio, unbonding period, proposal count
-
Validator distribution — status pie, commission distribution, top-10 VP chart
-
Rewards & delegators — outstanding rewards, delegators per validator (top 10)
-
Top validators table
 Decentralization
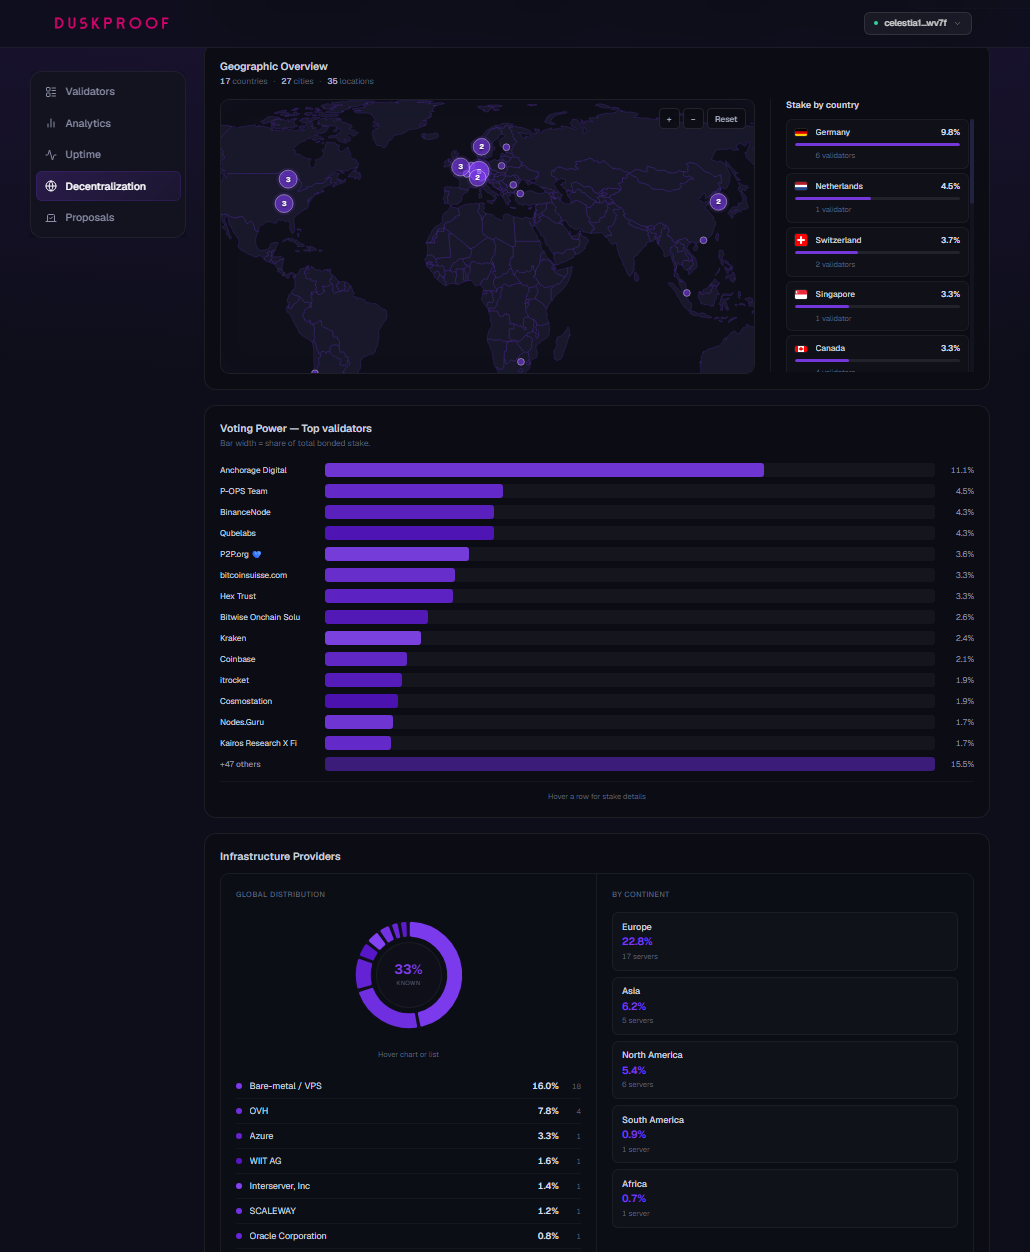
Decentralization Dashboard — /{project}/decentralization
-
KPIs: active validators, top continent/country, IP-resolved count
-
3D globe with validator locations (when geo data exists)
-
Voting power bars (top validators)
-
Infrastructure breakdown: datacenters, providers, continents
-
Validator table: location, provider, VP %
 Governance
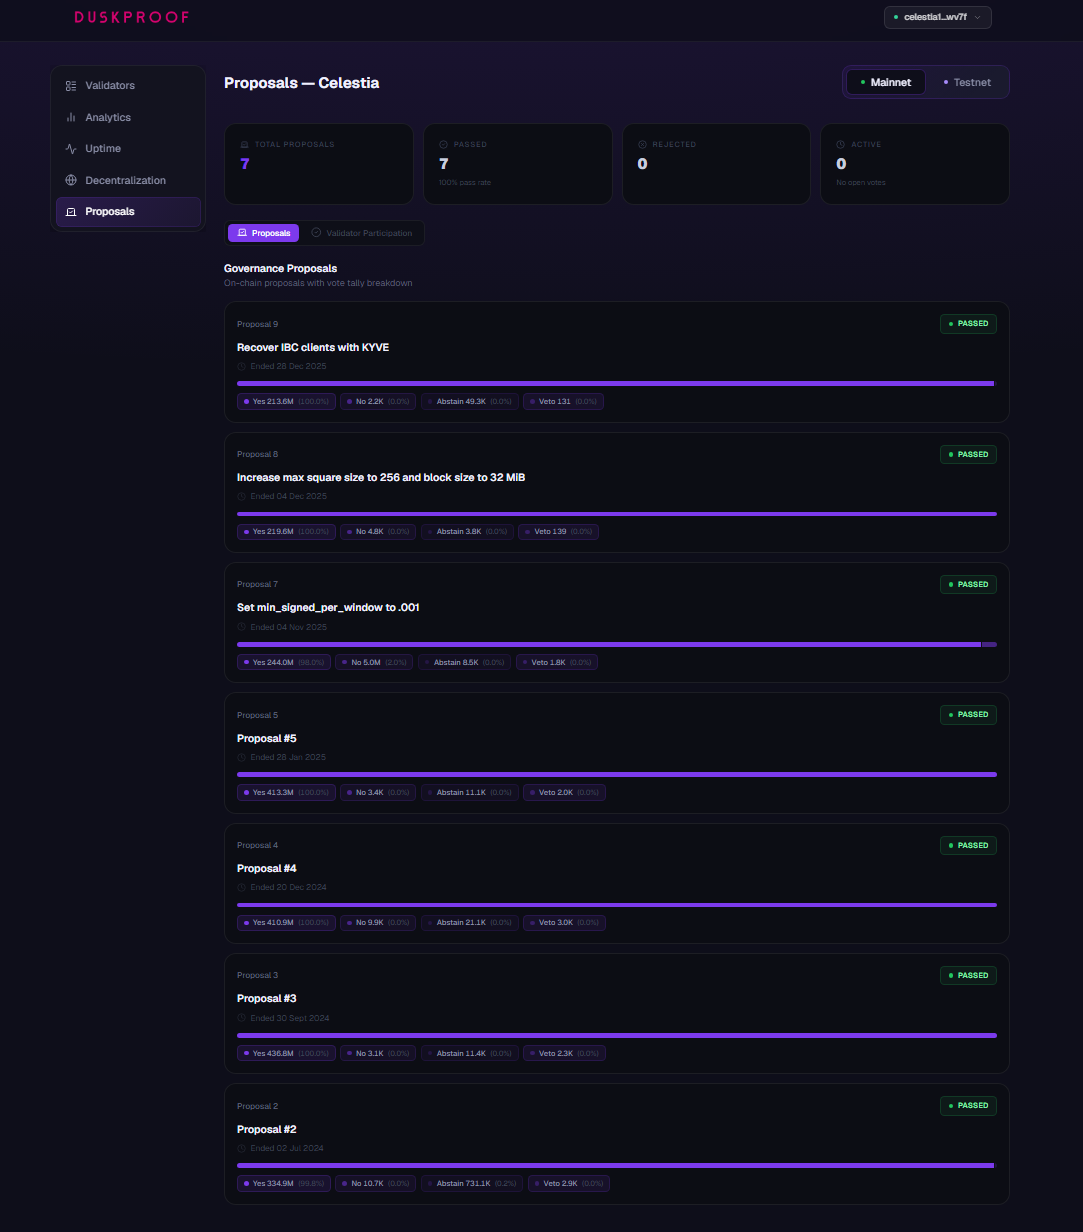
Proposals — /{project}/proposals
-
Proposal list with status, title, tally bars, voting timeline
-
Stats: total proposals, active count, participation coverage
-
Validator participation matrix — who voted Yes / No / Abstain / Veto on each proposal
-
Searchable validator list
Wallet (Keplr)
-
Connect wallet from navbar (Keplr, Cosmos chains)
-
Portfolio modal — balance, total staked, pending rewards, per-validator delegations
-
Stake / delegate from leaderboard and validator pages
-
Claim rewards — per validator or claim all
-
Undelegate — with unbonding period warning
-
Redelegate — amount + destination validator picker
-
Network switch inside portfolio when project has multiple networks
-
RPC proxy for signing (no CORS issues in browser
Background Indexing
Workers run on a schedule and feed the dashboards:
-
Validator index (every 5 min)
-
Analytics & block stats snapshots
-
Governance proposals & participation
-
Geo resolution for decentralization map
-
Token price polling
-
Chain stats & delegator counts
Live chain queries are used as fallback when cache is empty.
Public API
-
GET /api/v1/projects— list active projects -
GET /api/v1/projects/{slug}— project details -
Rich data endpoints: validators, stats, uptime, analytics, decentralization, proposals, wallet config, portfolio
Why we built it
Validator teams and delegators often jump between explorers, uptime tools, governance trackers, and wallets. We wanted one platform per network where you can monitor validators, analyze network health, track governance, and stake without leaving the browser.
Current Status
Platform is live at https://app.duskproof.com.
Active development — new metrics, chains, and UX improvements ongoing.
We’d appreciate community feedback!
-
Which dashboards are most useful for you?
-
What metrics are missing from uptime / analytics / decentralization?
-
Which networks should we add next?
-
Any APIs or tools worth integrating?
 Celestia: https://app.duskproof.com/celestia
 Twitter: @DuskProof
Thanks for any suggestions — it helps us prioritize what to build next.

