The Most Boring Chart in Crypto: Celestia's Economy, Priced in Real Objects
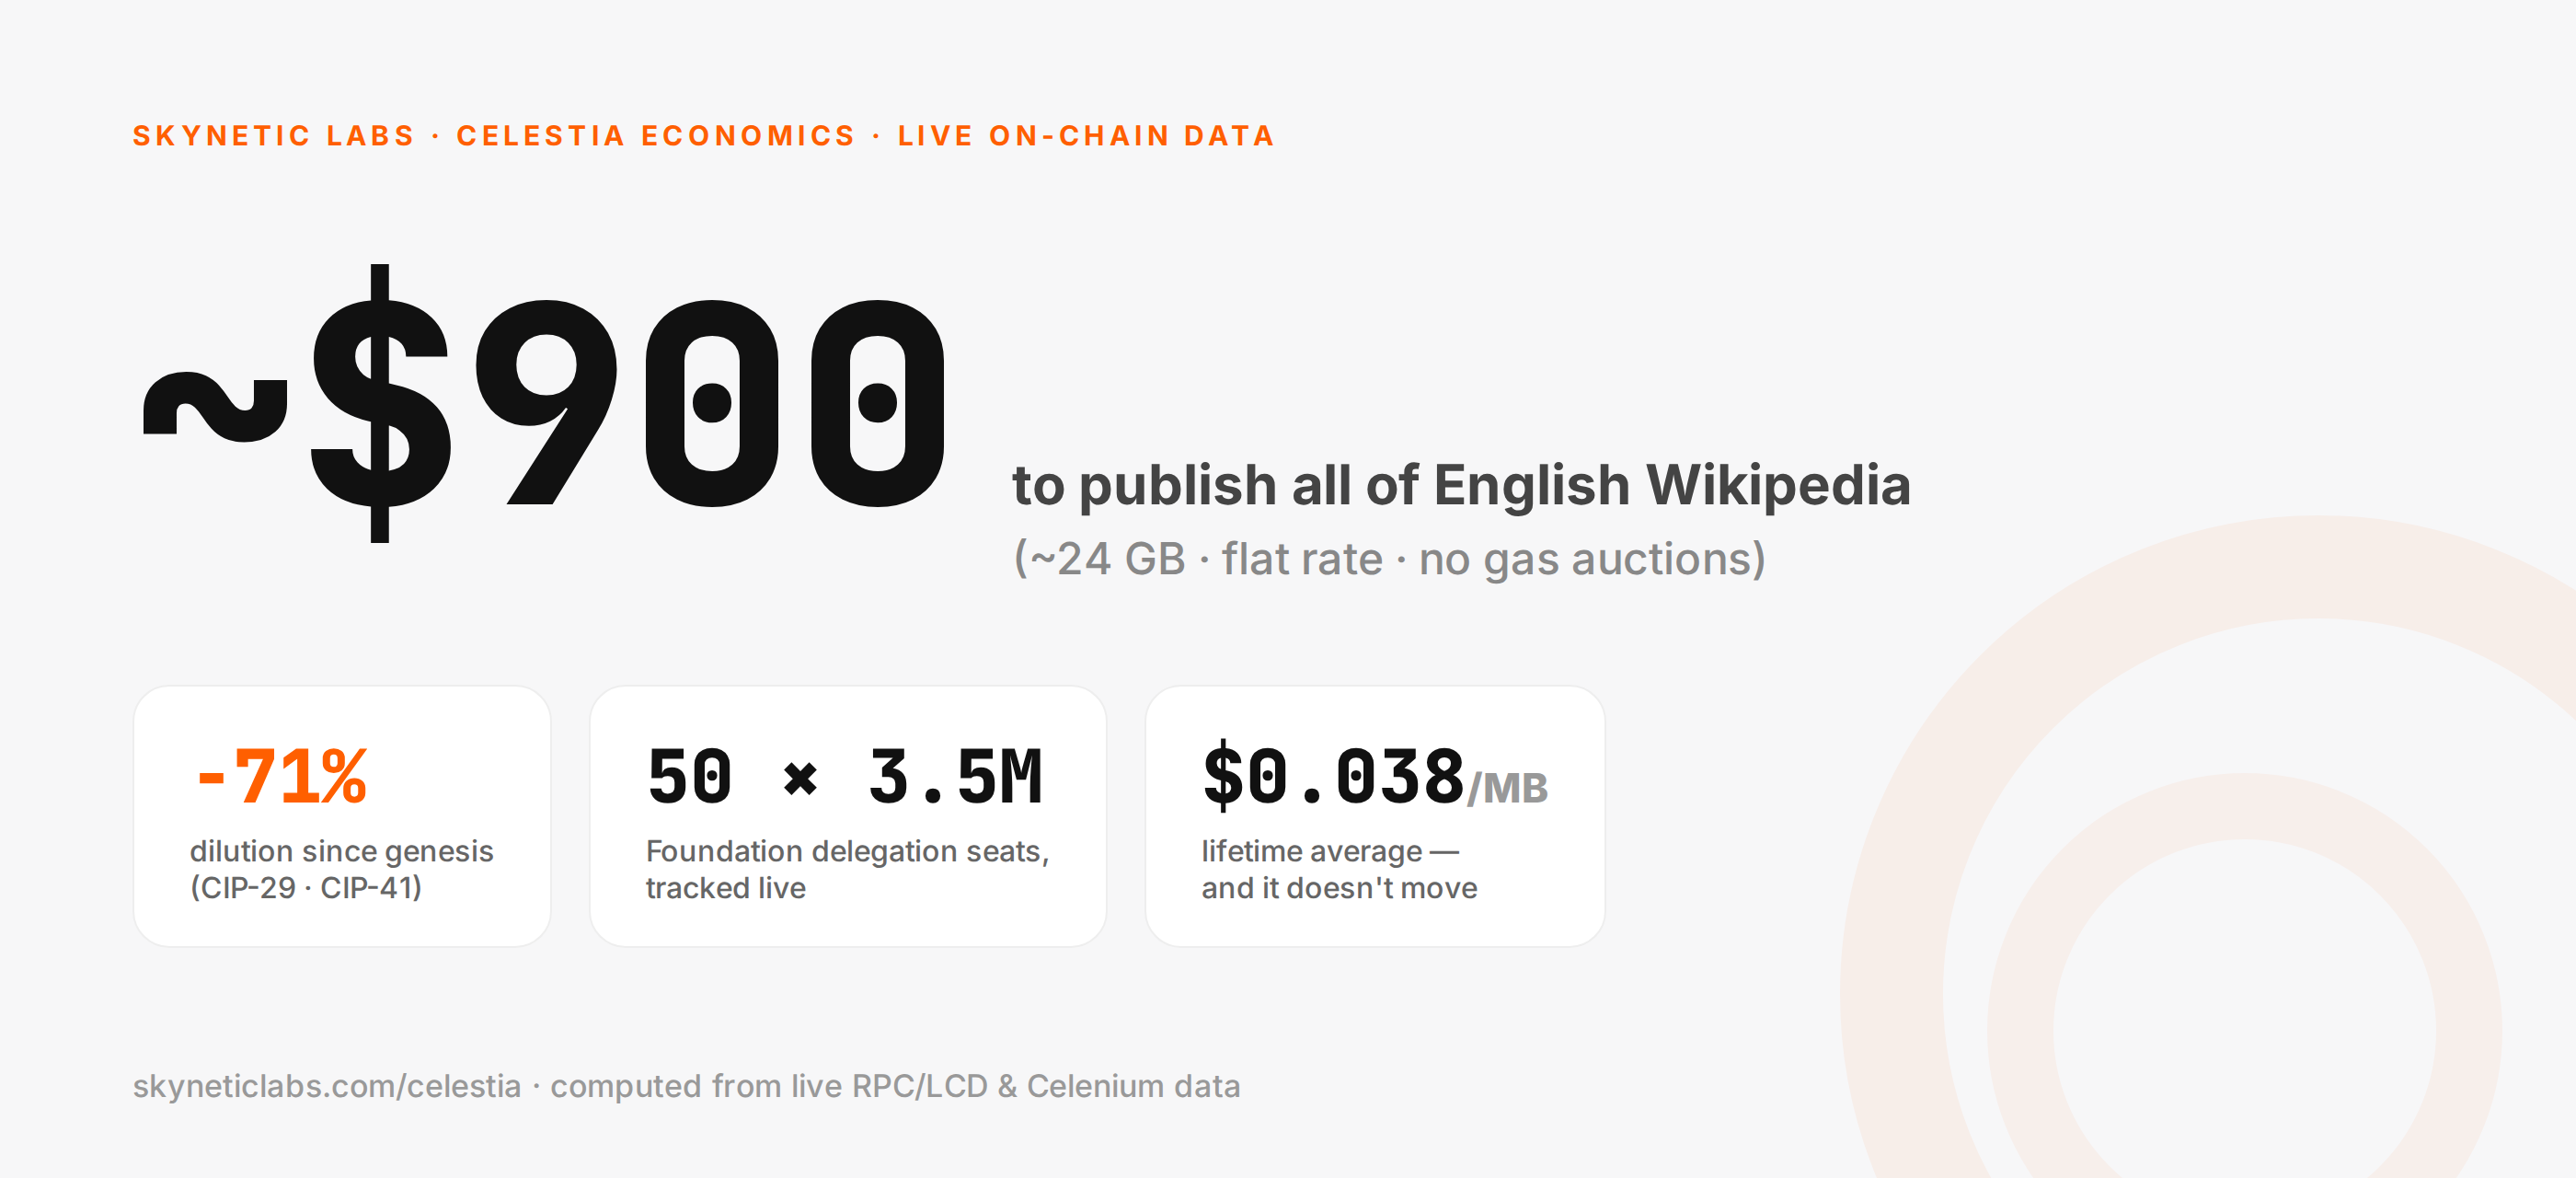
Disclosure: Skynetic Labs operates a Celestia validator and has an application in the current cohort review. This is our own analysis, not affiliated with or endorsed by the Foundation.
TL;DR
- Posting data to Celestia is a flat rate, not an auction, so you can price it in real objects to the cent: a phone photo ~$0.19, a lossless album ~$19, a 4K movie ~$567, all of English Wikipedia ~$908.
- The price doesn’t move even when capacity does. The v9 upgrade this week roughly doubled throughput (blocks now ~2.8s), yet with the network near 0.4% of capacity there’s nothing to bid for.
- Security is pre-funded by issuance (~26.9M TIA/yr) regardless of traffic, and the community has voted twice to cut its own inflation, from 8% toward a 1.5% floor: a ~71% reduction in dilution since genesis.
There’s a chart I keep coming back to, and it’s the least dramatic thing I’ve ever stared at.
It’s the price of posting data to Celestia, plotted over the network’s whole life. Most crypto fee charts look like a seismograph during an earthquake. This one looks like a ruler someone left on a table. A flat line. One detail is worth noticing. The v9 upgrade went live this week and roughly doubled the network’s throughput, part of the official push from a six-second to a three-second block target. Blocks now land in about 2.8 seconds. Capacity jumped.
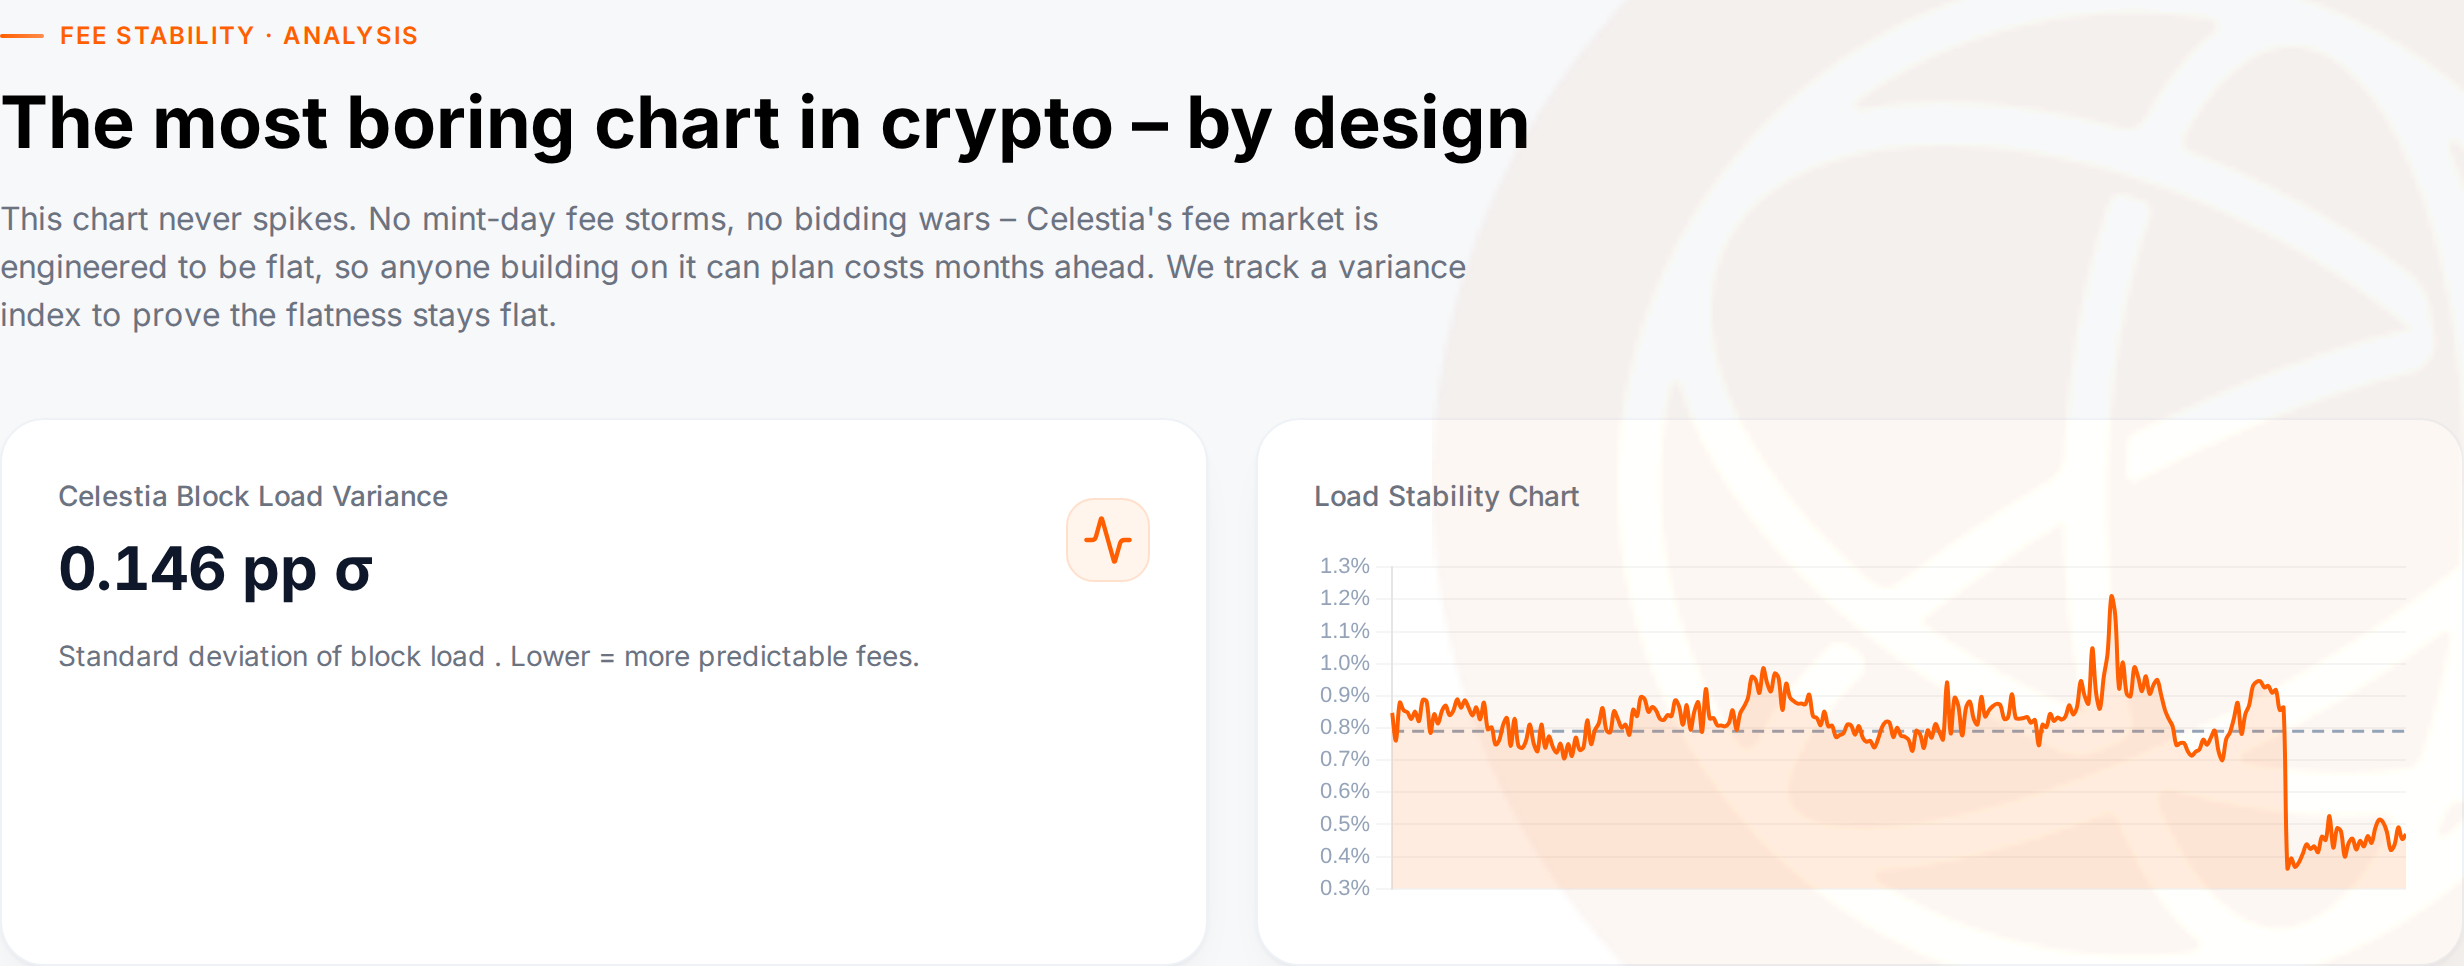
The most boring chart in crypto: the per-MB price of data over the network’s entire life.
So the first reaction isn’t “wow.” It’s “…why is nothing happening?”
That question is what this post is about. Once you understand why this chart is so uneventful, you understand the deliberate shape of Celestia’s economy, and why “boring” is the most valuable thing it can be for anyone building on it.
 Priced to the cent
The mechanism behind the flat line is that there is no auction. On most chains, when you want in, you’re bidding against everyone else who wants in. It’s a priority-fee dogfight where the price of a block is whatever the most desperate person will pay this second. Celestia doesn’t do that for data. It charges a flat rate per byte. No bidding war. No gas-auction. No “why did my fee 10x at 3pm.”
So you can do something you almost never can with an on-chain resource: divide, and get a stable number. Take every fee the network has ever charged for data and divide it by every byte ever posted, roughly 424,000 TIA over about 4.34 terabytes of blobs. That comes out to about 0.098 TIA per megabyte, or $0.038/MB at today’s TIA price of around $0.39.
There’s no magic in what follows. The magic is that a per-unit price exists at all and holds still long enough to multiply. Spend that single figure on things you can hold in your hand:
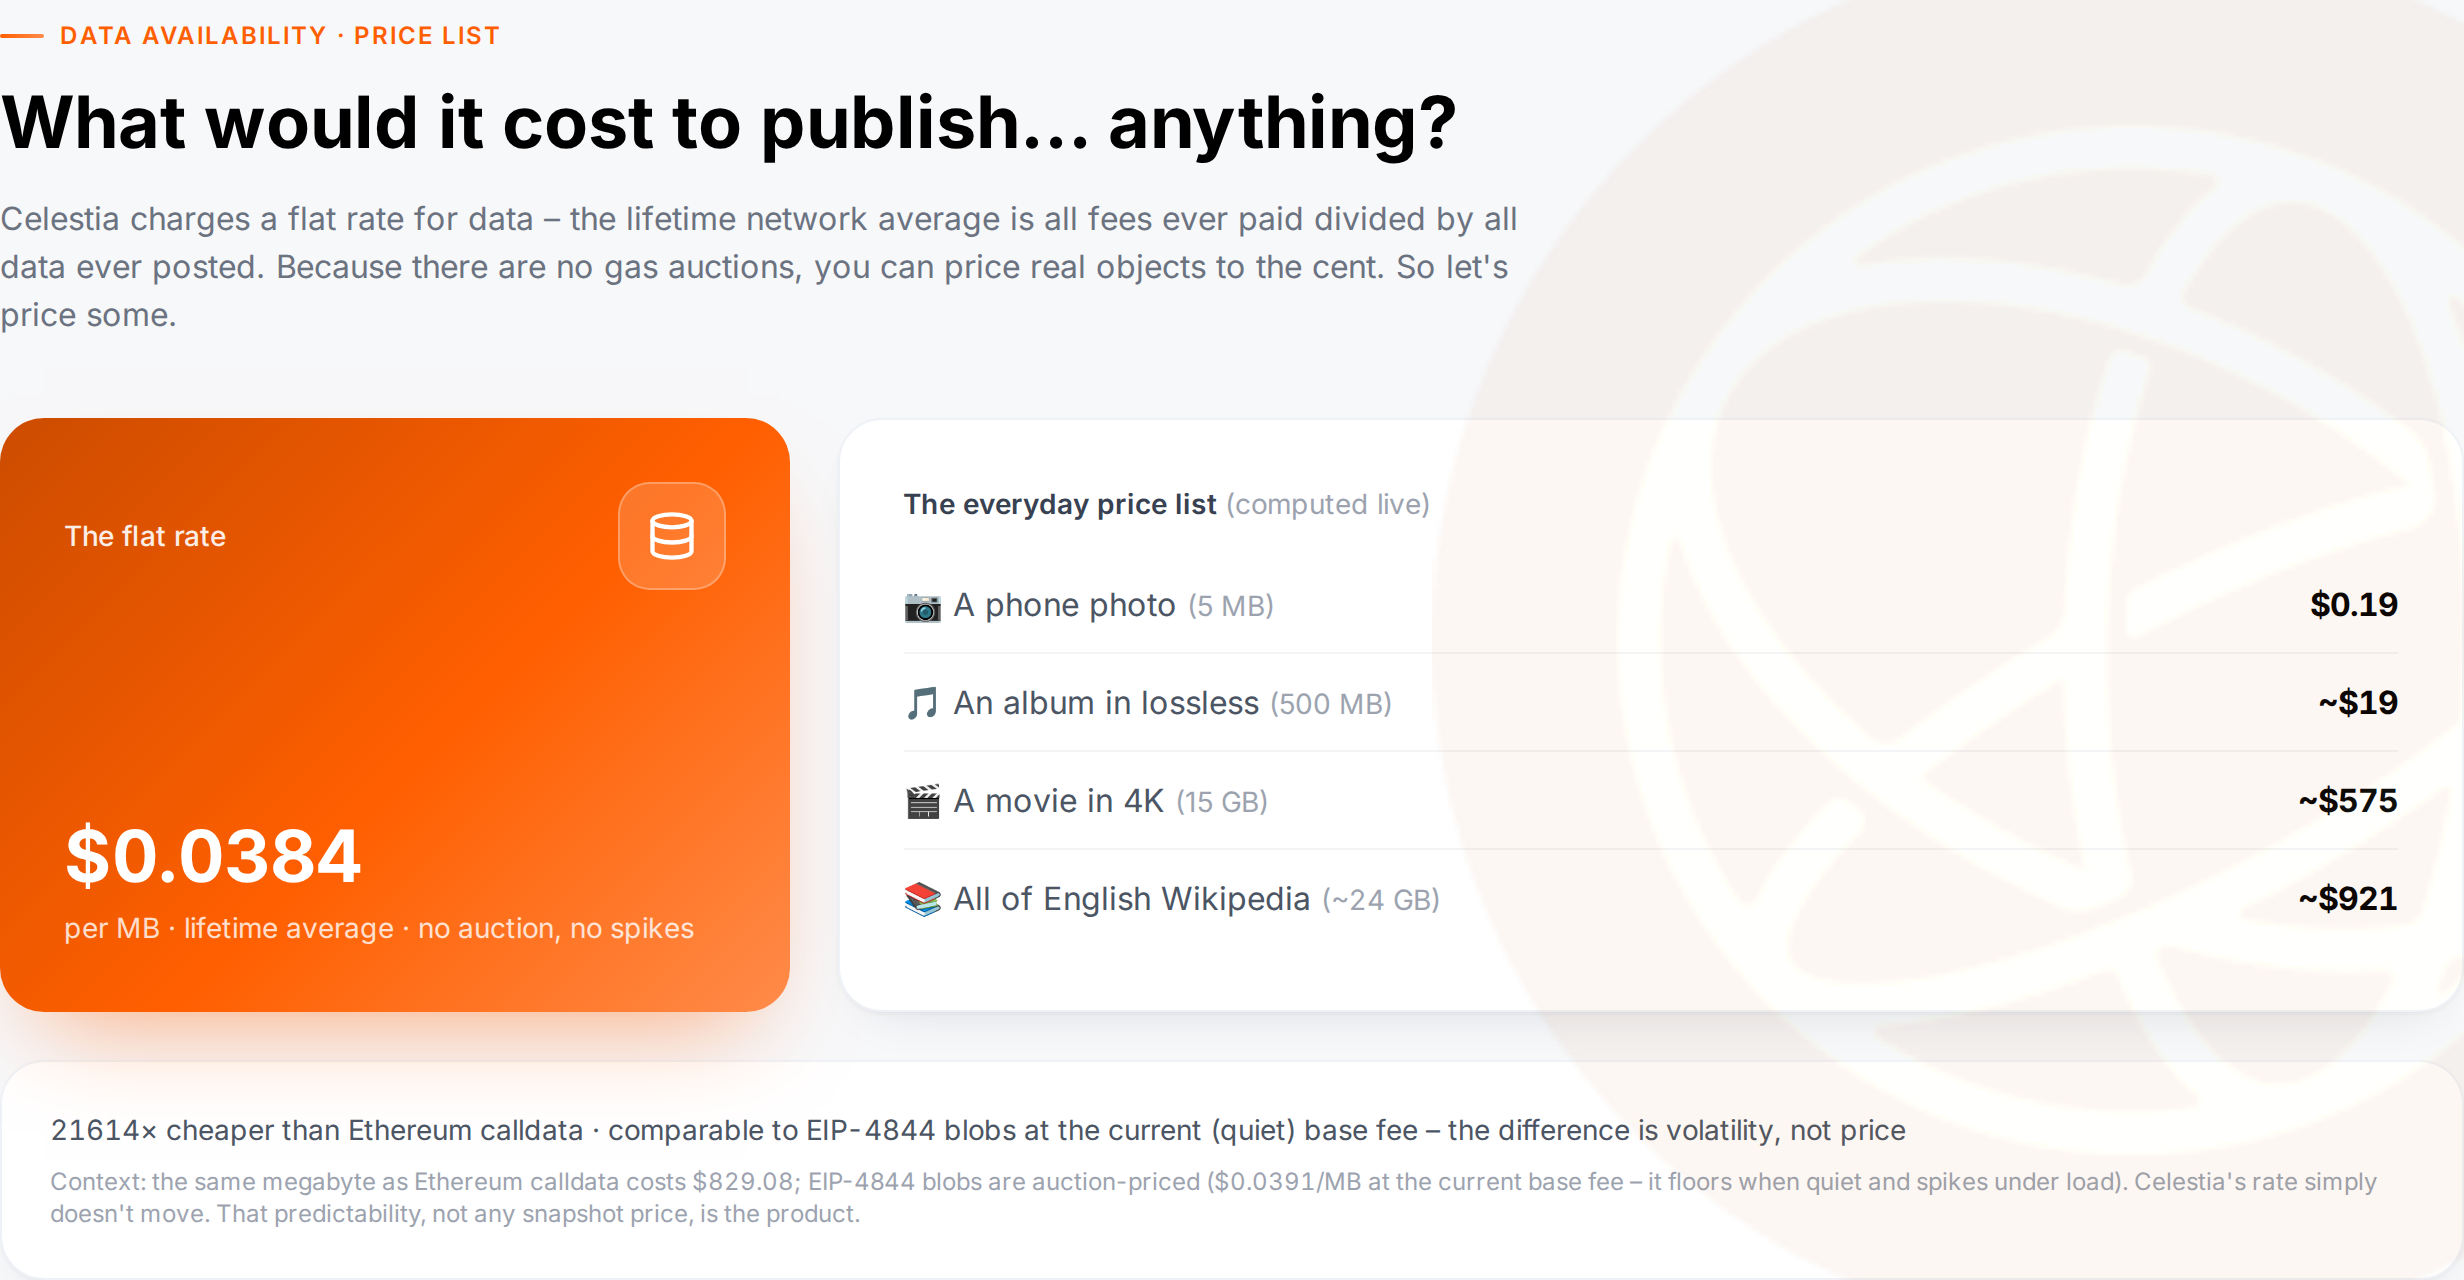
The everyday price list, computed live from lifetime network averages.
Read that last line again. You could publish all of English Wikipedia to a decentralized data-availability layer for less than the price of a used laptop. Those numbers are stable enough to quote for the same reason the chart is flat: no auction means no surprise. It reads more like a water bill: units in, dollars out.
 Nothing to bid for
The other half of the flatness is simpler than it sounds. The network is currently running at roughly 0.4% of its capacity. When a highway is 99.6% empty, there’s no traffic jam to pay your way out of. There’s nothing to bid for.
You can watch this in a stat called fee variance, which measures how much the per-MB price bounces around. For essentially the entire tracked history of the chain, it has sat near zero. Traffic spikes, and the price shrugs. Even this week’s throughput doubling, the kind of event that would jolt fees on an auction-based chain, did nothing to the per-MB cost, because supply got cheaper to provide instead of scarcer.
For a builder, that turns data availability from a wild card into a line item. You can budget it months ahead the way you budget a cloud bill, putting a real number in a spreadsheet and trusting it. In an industry where “gas was insane today” is a normal sentence, being able to forecast your costs is a big deal.
 Where the cheap comes from
So if nobody’s paying much, what keeps the network secure?
This is the part that flips the intuition. On an auction chain, security comes from the fees, and a quiet day is a lean day for the people keeping the lights on. Celestia decouples the two. Security is pre-funded by protocol issuance, roughly 26.9M TIA a year paid to the 100 active validators regardless of how busy the network is. The lights stay on whether it’s a flat Tuesday or a record day.
User fees today cover only a small slice of that budget, around 0.6%. That’s what you’d expect from a young network whose customers, the rollups, are still spinning up. It’s the number to watch as they scale, the way you’d watch a new city’s tax base grow into its roads. Nobody’s waiting on it to keep the network safe. The safety is already bought.
 A network cutting its own paycheck
What made me respect the design, not just note it:
You’d assume a network paying for its own security out of issuance would cling to that issuance. Celestia is doing the opposite. It’s shrinking its own budget on purpose. TIA launched at 8% inflation on a published schedule that decays 10% a year. Then the community stepped in and steepened the curve, twice. CIP-0029 (“Lotus,” the v4 upgrade, July 2025) pulled the trajectory toward ~5%. CIP-0041 (v6, November 2025) took it further, toward ~2.5%. Today inflation reads about 2.29%, gliding toward a hard floor of 1.5%.
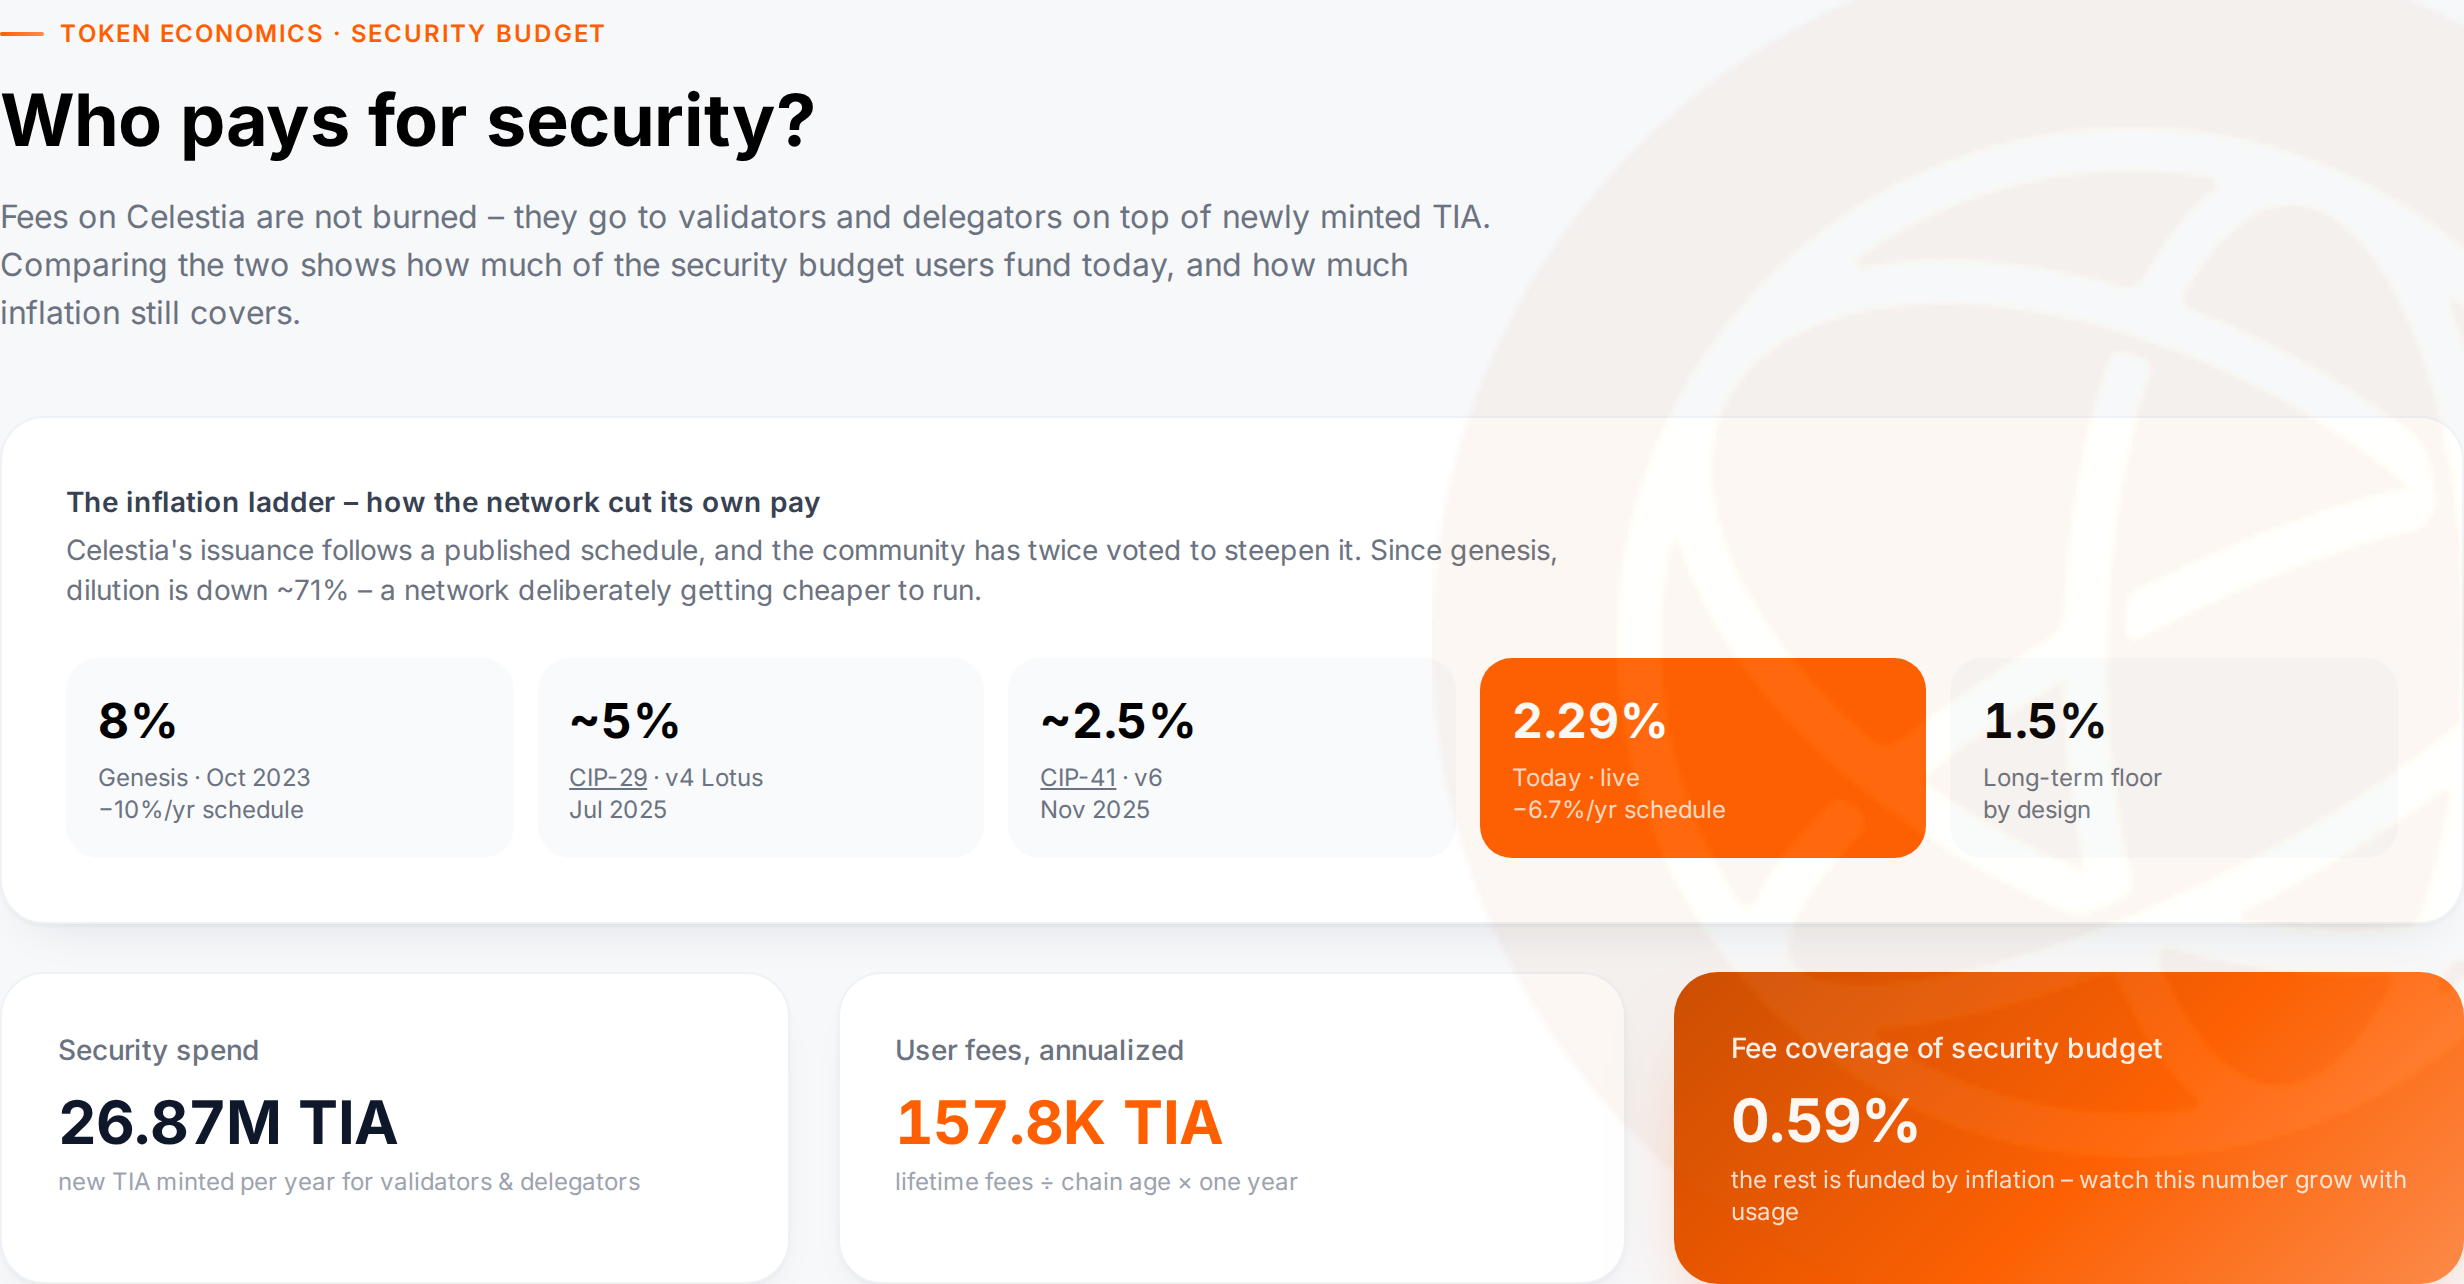
The inflation ladder: 8% → ~5% (CIP-0029) → ~2.5% (CIP-0041) → 1.5% floor, all scheduled and voted.
Dilution is down roughly 71% since genesis. Every step was scheduled. Every step was voted. None of it was discretionary emergency tinkering. Token holders repeatedly chose to print less. (A steady 2% of block rewards still routes to a community pool, so the ecosystem keeps a treasury as issuance falls.) Plenty of networks talk about “sound money.” Very few convene their holders to shrink the budget that pays for their own security, on a timetable, and fewer still do it twice in six months.
Put the two halves together and the economy hangs together fine. You get a flat, knowable price for data, kept stable by enormous headroom, with security pre-funded so cheapness never threatens safety, while the funding itself tapers on a public schedule as the network waits for demand to grow into it. It’s cheap to use, easy to plan around, and getting less dilutive every year. For context on where the stake sits, about 42.8% of total supply is currently bonded.
 Check the math
None of these numbers stand still. TIA’s price moves and the on-chain totals keep growing, so the receipt above is recomputed hourly. We built a small Celestia economics dashboard to do that arithmetic in the open, precisely so you don’t have to take our word for the per-MB figure or the inflation glide. Poke at it. If your math disagrees with ours, we want to know where.
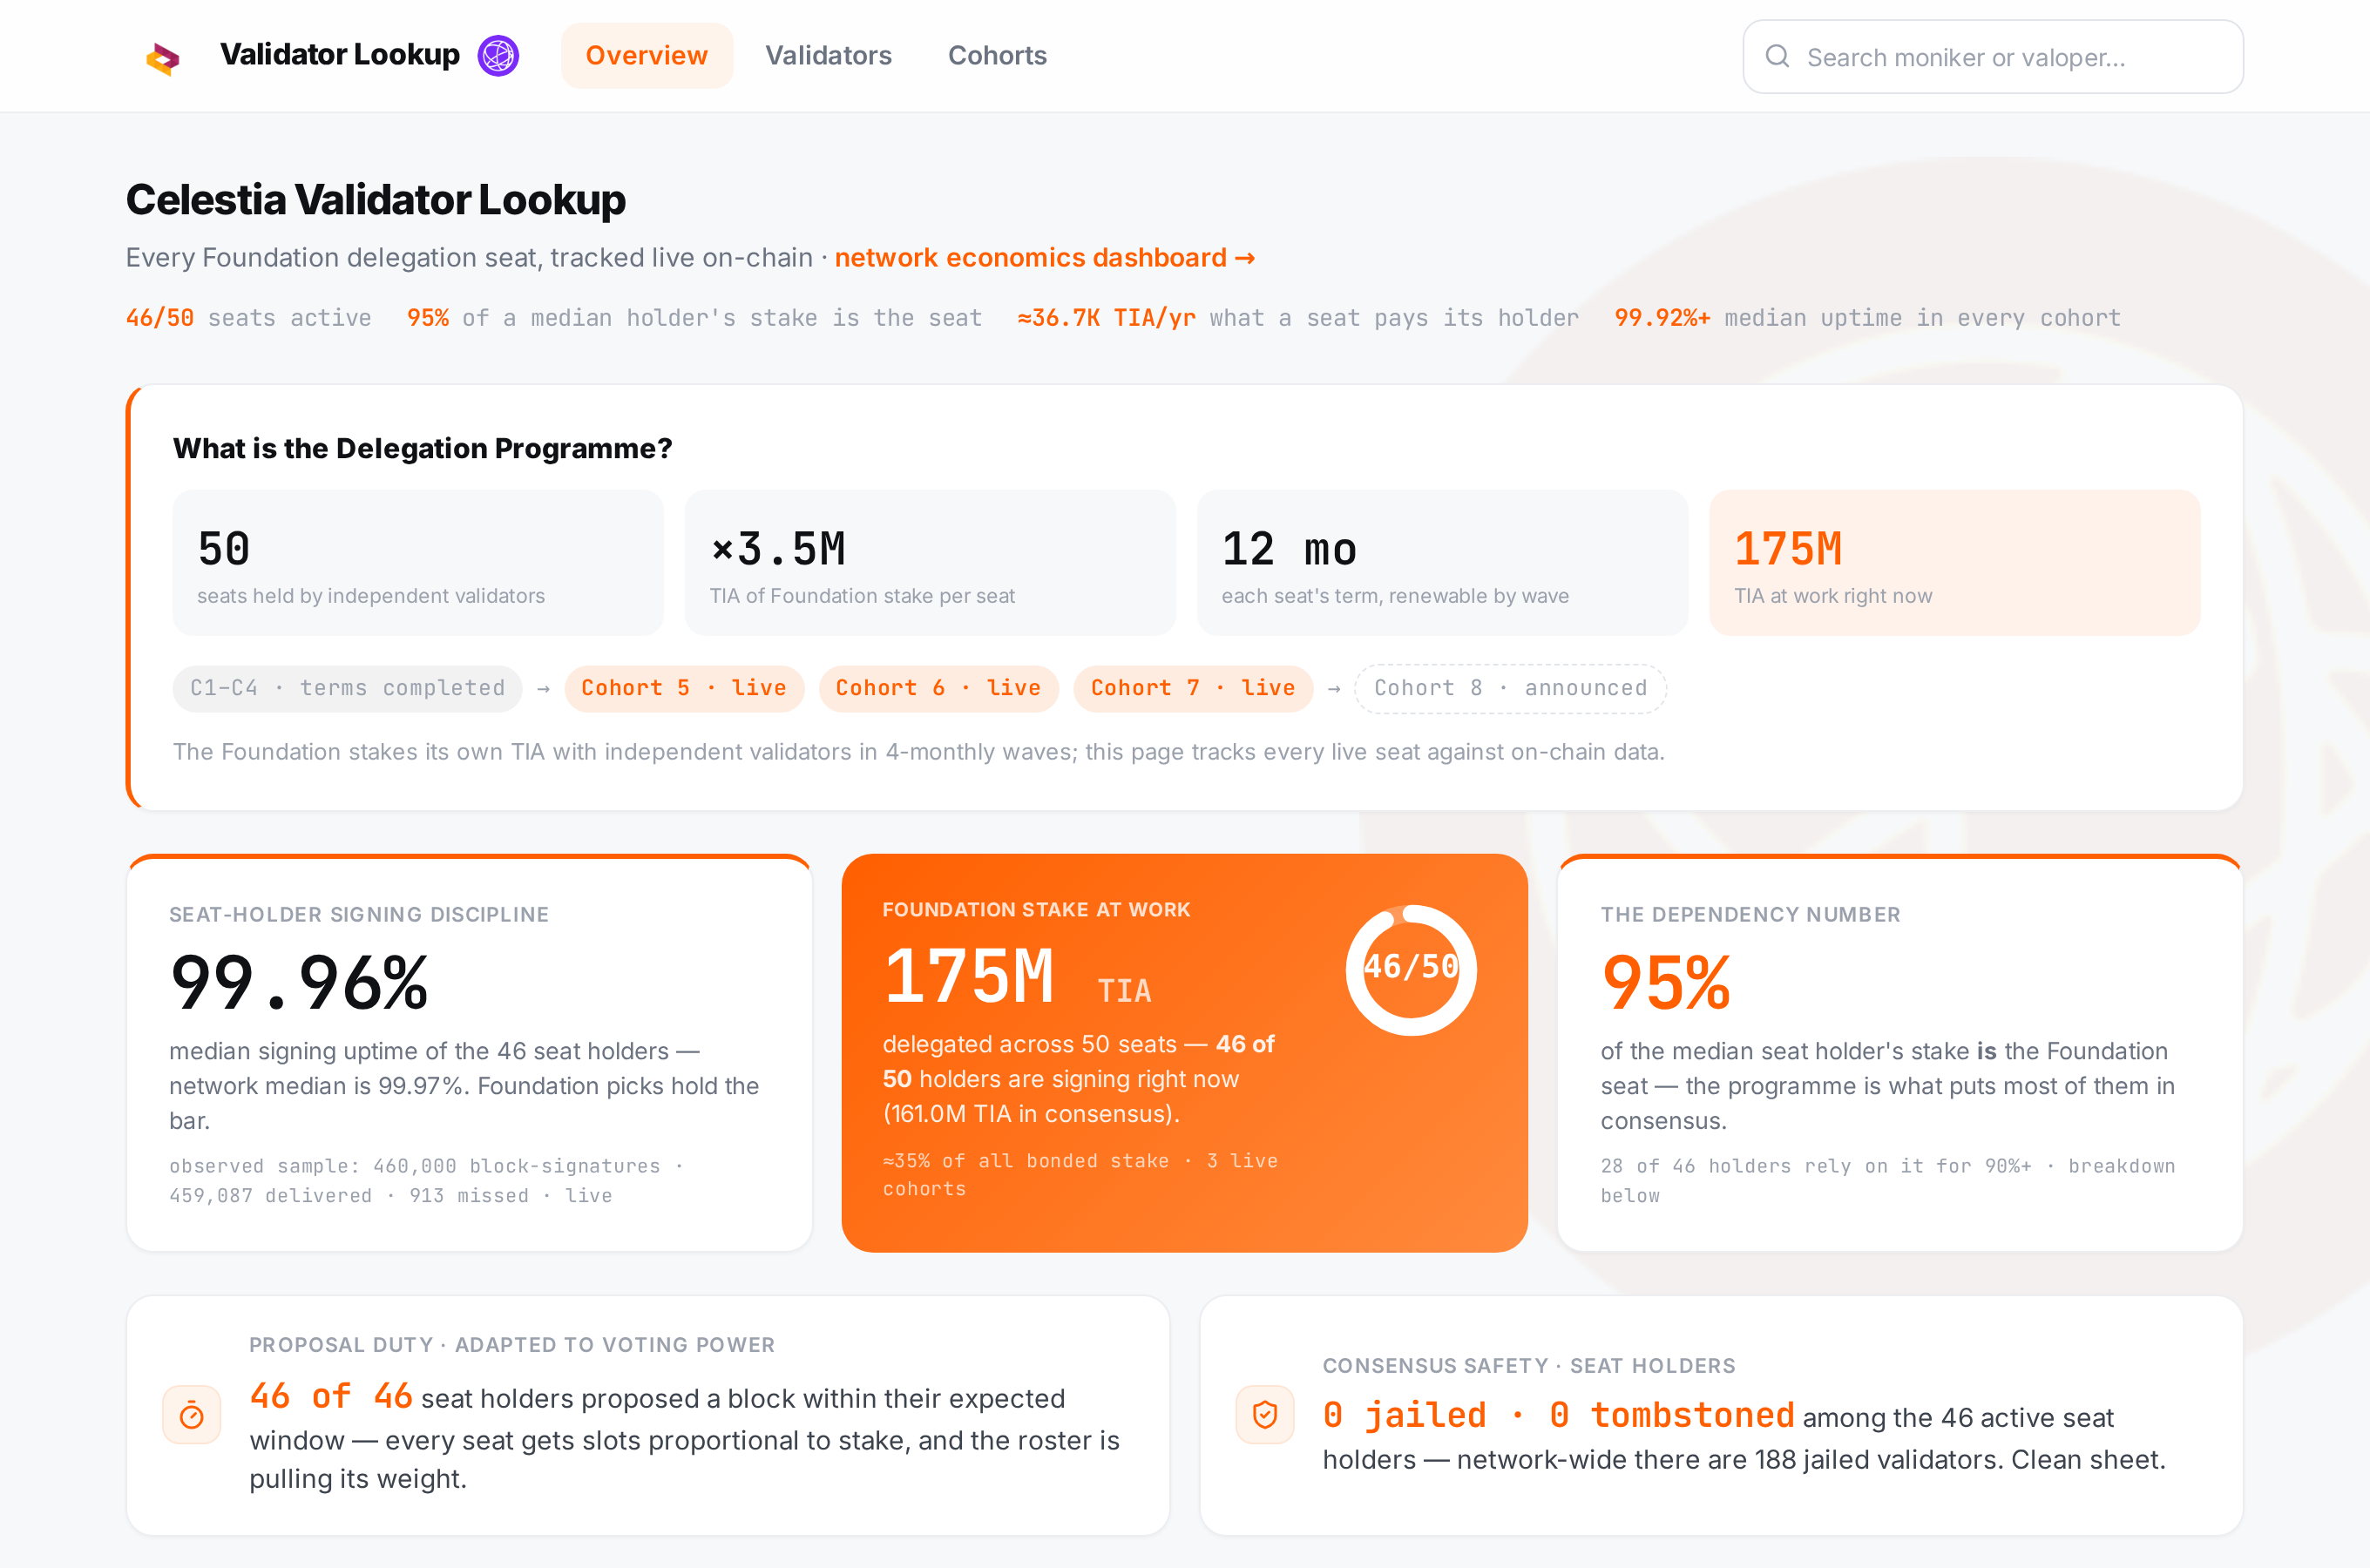
Underneath the economy: every Foundation delegation seat, tracked live on-chain.
One layer sits underneath all of this and is worth a closing pointer. The Celestia Foundation’s Delegation Programme stakes 3.5M TIA with each of 50 independent validators across three live cohorts, about 175M TIA, roughly a third of everything bonded, and every seat is trackable on-chain, one at a time, at the validator lookup. (We run one of those validators, hence the disclosure up top.)
The point of a boring chart is that you can check it, and it’ll still be flat when you do. Which leaves one honest question worth sitting with: if data availability stopped being the exciting, unpredictable part of your stack, what would you build on top of it?
Skynetic Labs: reading Celestia’s economy in plain numbers.
 Dashboard: SkyneticLabs – Celestia Economic Dashboard, Live Costs and Yields
Seat tracker: SkyneticLabs – Celestia Validator Lookup and Cohort Analytics

