Celestia Terraform Datadog Modules
Celestia Terraform Datadog Modules
Explore the Celestia Terraform Datadog Modules directory, dedicated to providing Terraform modules crafted to streamline the deployment of essential Datadog resources. These modules are meticulously designed to empower efficient monitoring and observability across Celestia Data Availability & Consensus Nodes, enhancing your monitoring capabilities and ensuring a seamless experience in overseeing your performance.
⚙️ Prerequisites
Before you begin using the Terraform modules in this directory to deploy Datadog resources for monitoring the Celestia network, ensure that you have the following prerequisites in place:
1. Install Terraform
To install Terraform, follow the platform-dependent instructions provided in the official Terraform installation guide.
2. Configure DataDog Provider
You will need to configure the DataDog provider in your Terraform environment to establish a connection with your Datadog account. Below is an example of how to configure the provider in your Terraform configuration:
provider "datadog" {
  api_key = var.datadog_api_key
  app_key = var.datadog_app_key
}
Both datadog_api_key and datadog_app_key are unique to each Datadog account and are essential for authenticating your Terraform deployments with Datadog. To set these values, create a terraform.tfvars file in your working directory and define the keys as follows:
datadog_api_key = "<your_datadog_api_key>"
datadog_app_key = "<your_datadog_app_key>"
Replace and with your actual Datadog API key and application key.
Note: Datadog API and App Keys
To integrate with Datadog services and export metrics, you'll need both API and App keys. Generate them in your Datadog Organization Settings:
- Log in to your Datadog account.
- Navigate to Organization Settings.
- Generate API and App keys in the designated section.
- Copy and use these keys where required for seamless integration and metric visualization.
3. Install Docker Compose
To install Docker, follow these steps:
curl -fsSL https://download.docker.com/linux/ubuntu/gpg | sudo apt-key add -
sudo add-apt-repository "deb [arch=amd64] https://download.docker.com/linux/ubuntu focal stable"
sudo apt update
sudo apt install docker-ce
After installing Docker, add your user to the Docker group to run Docker commands without sudo:
sudo usermod -aG docker ${USER}
To install Docker Compose, run the following commands:
sudo curl -L "https://github.com/docker/compose/releases/download/1.29.2/docker-compose-$(uname -s)-$(uname -m)" -o /usr/local/bin/docker-compose
sudo chmod +x /usr/local/bin/docker-compose
docker-compose --version
4. Enabling Metrics on Bridge Node
To enable metrics on the Bridge Node, you can utilize the following options when starting the Bridge process using celestia bridge start:
--metrics: This flag enables OTLP metrics with HTTP exporter.--metrics.endpoint: This option sets the HTTP endpoint for OTLP metrics to be exported to. By default, it is set to "localhost:4318".--metrics.tls: This flag determines whether to enable TLS connection to the OTLP metric backend. By default, it is set to true.
Ensure to include these options when starting the Bridge process:
celestia bridge start --metrics --metrics.endpoint=localhost:4318 --metrics.tls=true
Remember that there might be other options and flags available to configure additional properties of the Bridge user. Check the documentation or help command (celestia bridge start --help) to explore all available options and customize the configuration according to your needs.
5. Starting OpenTelemetry Collector with Datadog Exporter
Follow these steps to start the OpenTelemetry Collector process with the Datadog exporter:
cd otel-collector
cp .env.example .env
Replace <DD_API_KEY> with your Datadog API key and <DD_SITE> with your Datadog site in the .env file:
DD_API_KEY="<DD_API_KEY>"
DD_SITE="<DD_SITE>"
Start the Docker container using the provided Docker Compose file located within the same directory:
docker-compose up -d
Check the running processes:
docker-compose ps
If everything was configured correctly and the proper Datadog key was provided, after several minutes, you should be able to see metrics in the Datadog Metrics Explorer.
If the container failed to start or if there are no metrics visible in the Datadog Explorer, as a first step, it's recommended to check the Docker Compose logs by using:
docker-compose logs -f
🛠️ Terraform Modules
Explore the specialized modules available within this directory:
| Module | Description |
|---|---|
| dashboards | Terraform modules tailored for creating and managing Datadog dashboards specifically configured to visualize critical data and insights related to the Celestia network and its components. |
| monitors | Terraform modules designed to facilitate the setup and management of Datadog monitors. These monitors play a crucial role in proactively detecting and alerting on performance issues and anomalies within the Celestia network. |
Feel free to navigate to the subdirectory that aligns with your specific monitoring needs. Each subdirectory's README provides detailed information on how to use the corresponding Terraform modules, along with configuration options and best practices.
Choose the module that suits your requirements and leverage the power of Datadog for monitoring and ensuring the performance and reliability of the Celestia network.
Example Installation of Bridge Dashboard & Monitors
Here's an example of how to use Terraform modules to set up dashboards and monitors for Celestia Bridge:
module "datadog-dashboards" {
  source = "./terraform-modules/datadog/dashboards"
}

module "datadog_monitors" {
  source = "./terraform-modules/datadog/monitors"

  service = "bridge"
  environment = "mainnet"
}
In this example:
The datadog-dashboards module is used to create and manage Datadog dashboards tailored for Celestia Bridge monitoring.
The datadog_monitors module is utilized to set up monitors specific to Celestia Bridge in the specified environment (in this case, "mainnet").
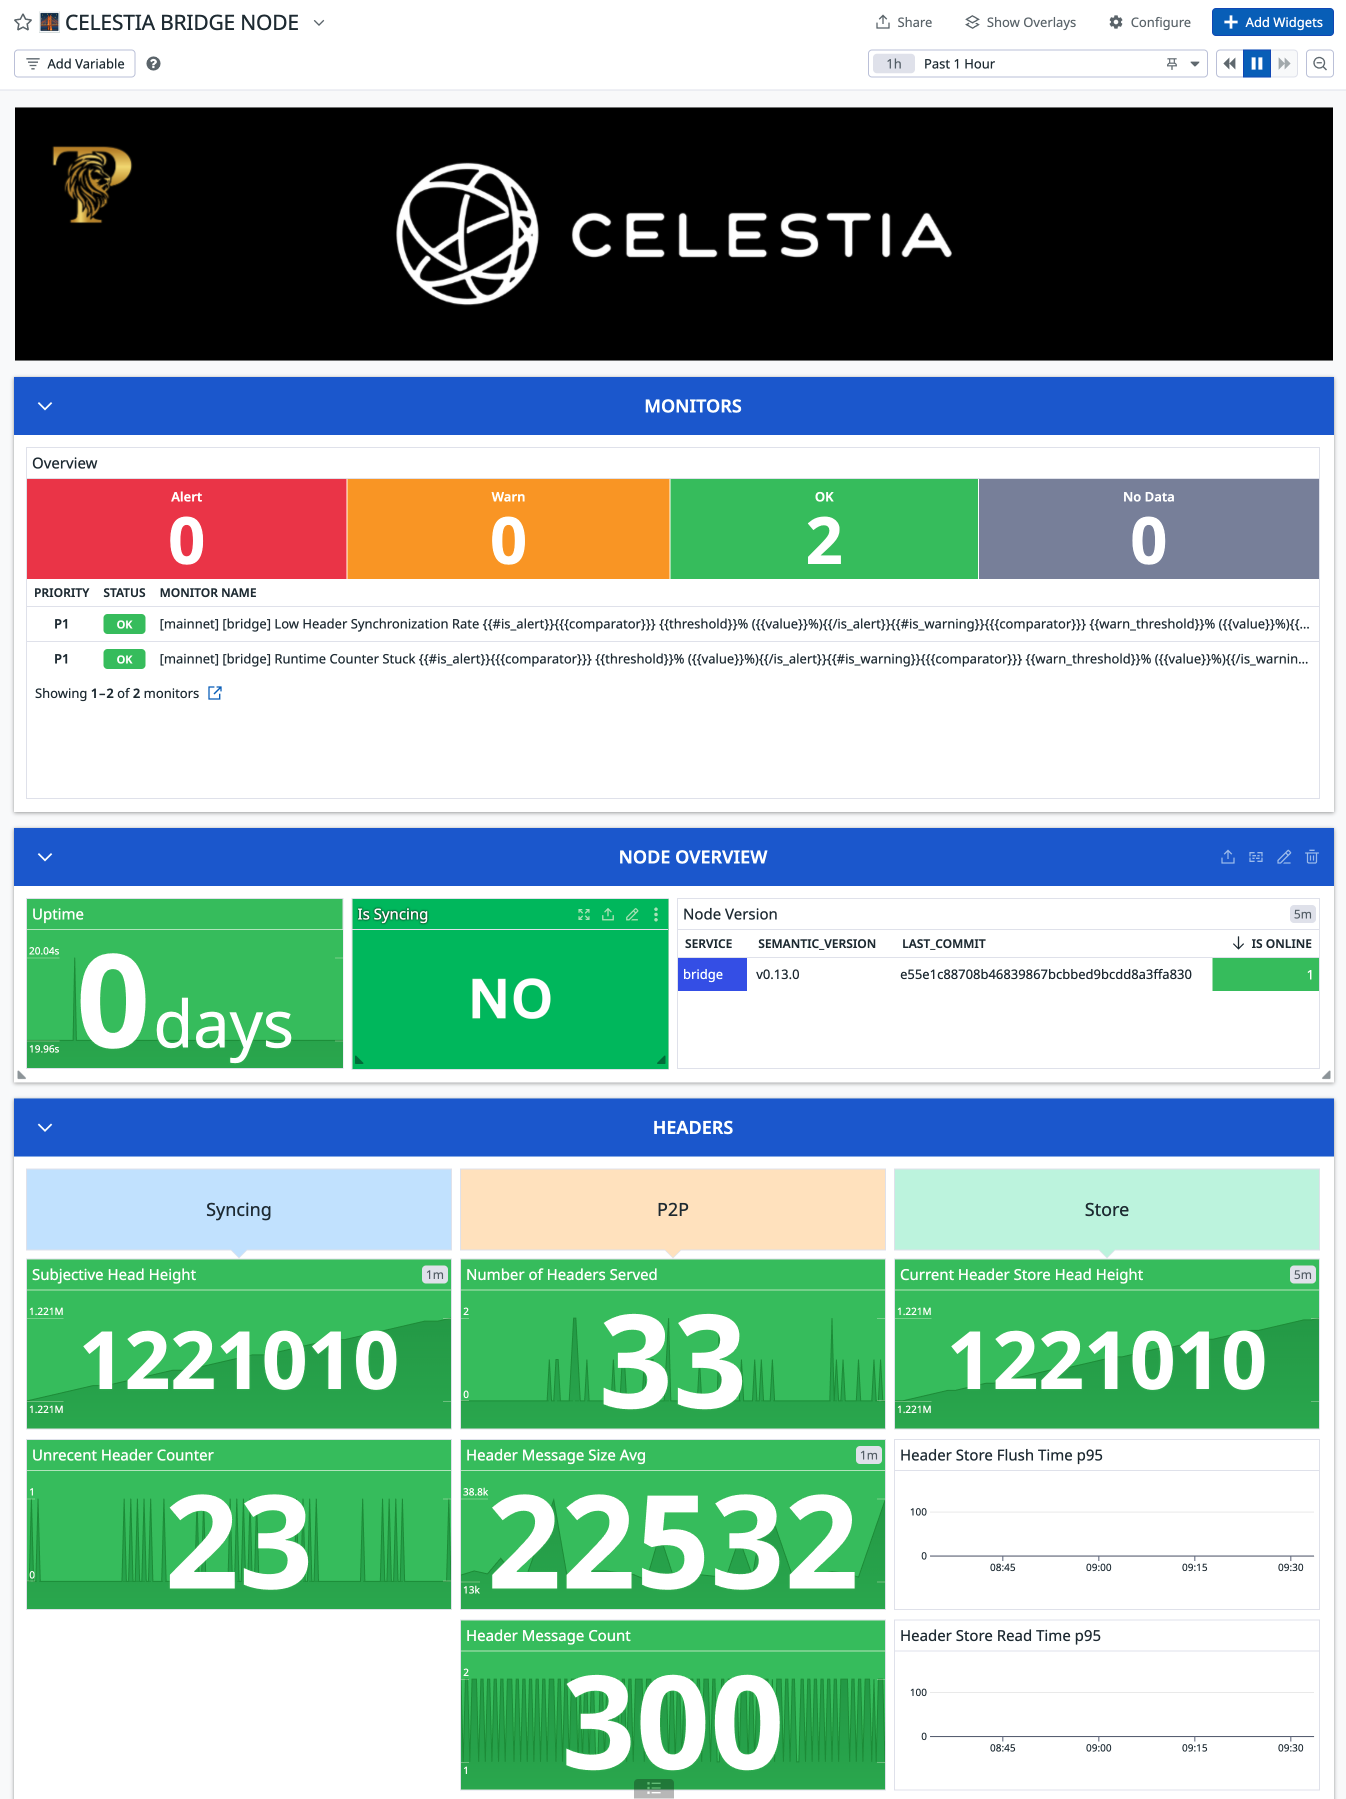
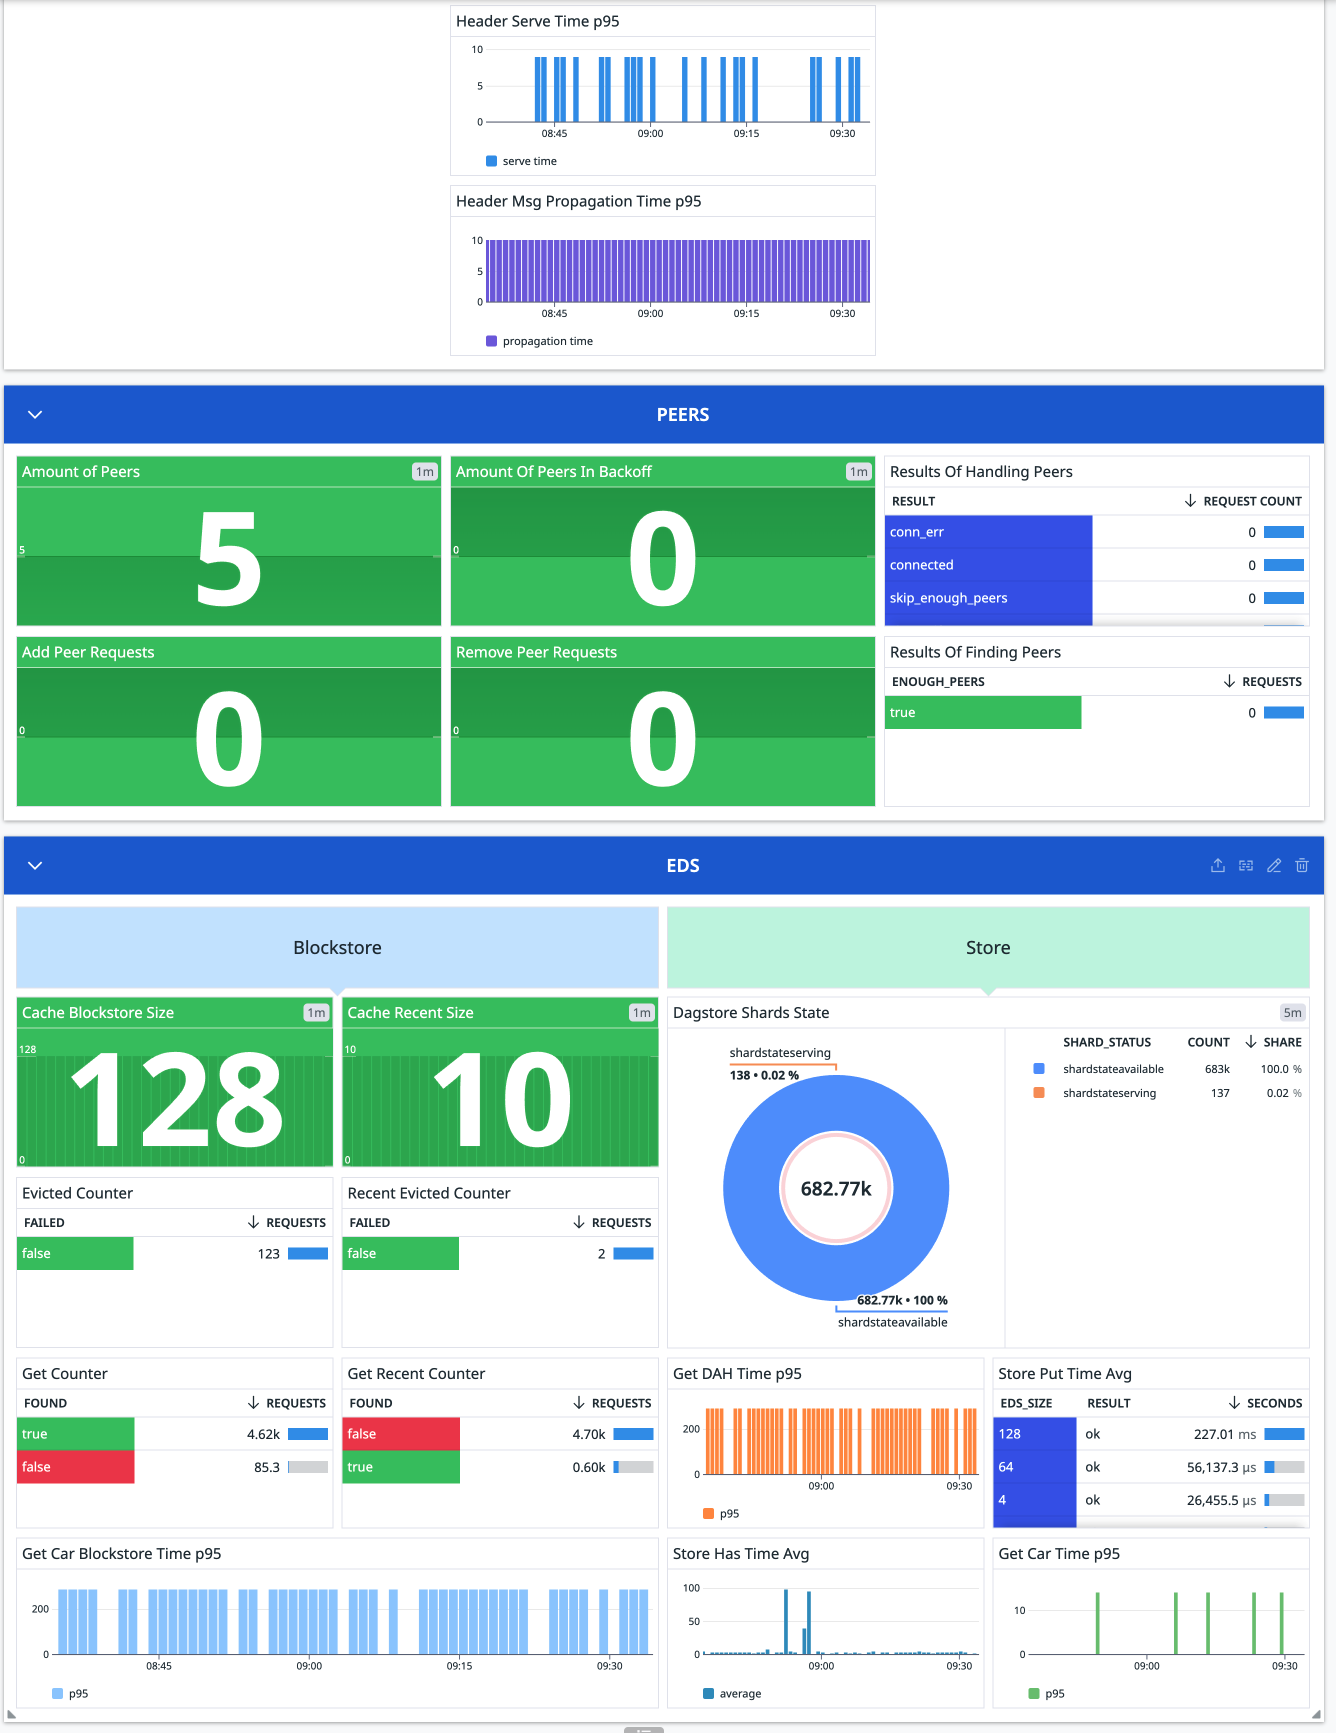
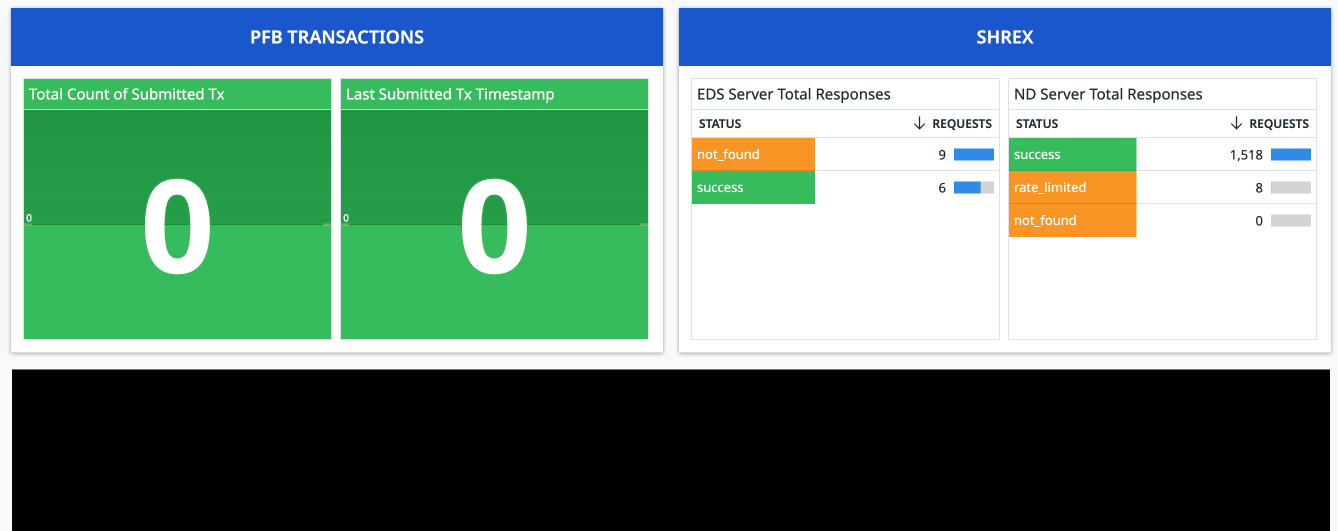
Final Result in Datadog